Data work with real outcomes.
A selection of dashboards, reports, and analysis projects — each one focused on solving a concrete business question.
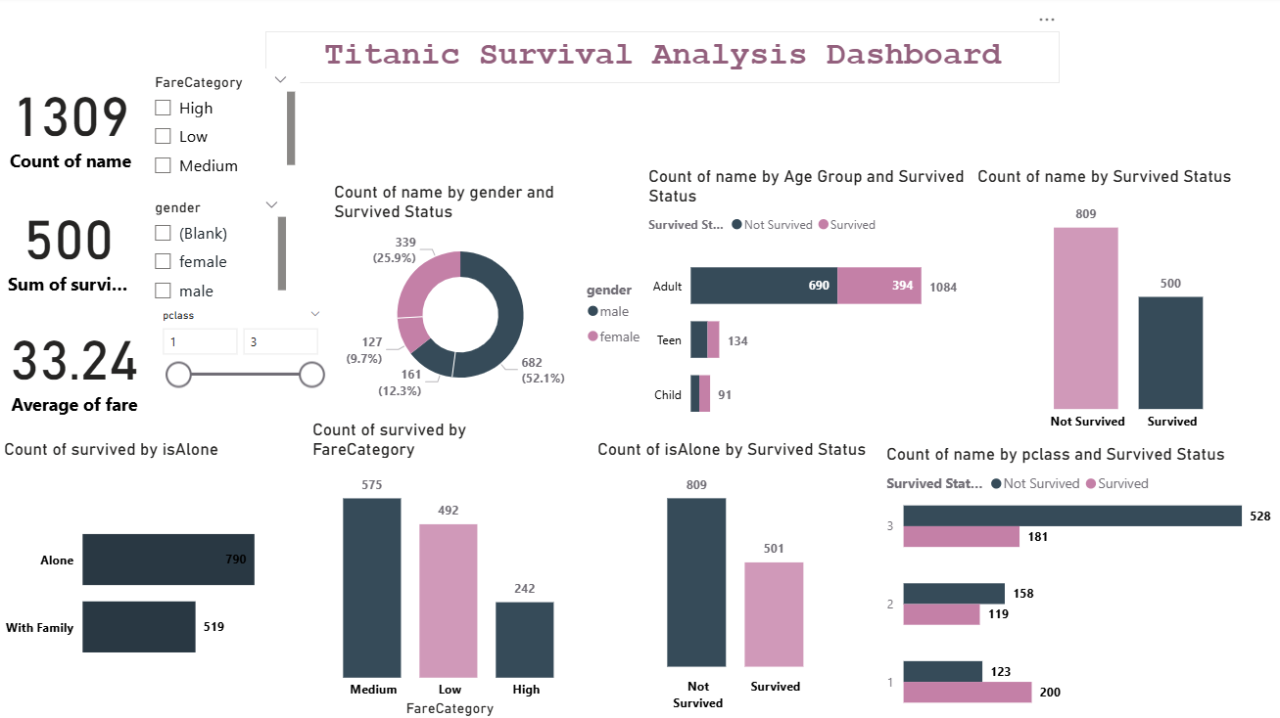
Titanic Survival Analysis Dashboard
Interactive Power BI dashboard exploring survival patterns from the Titanic dataset across gender, age group, class, and fare category.
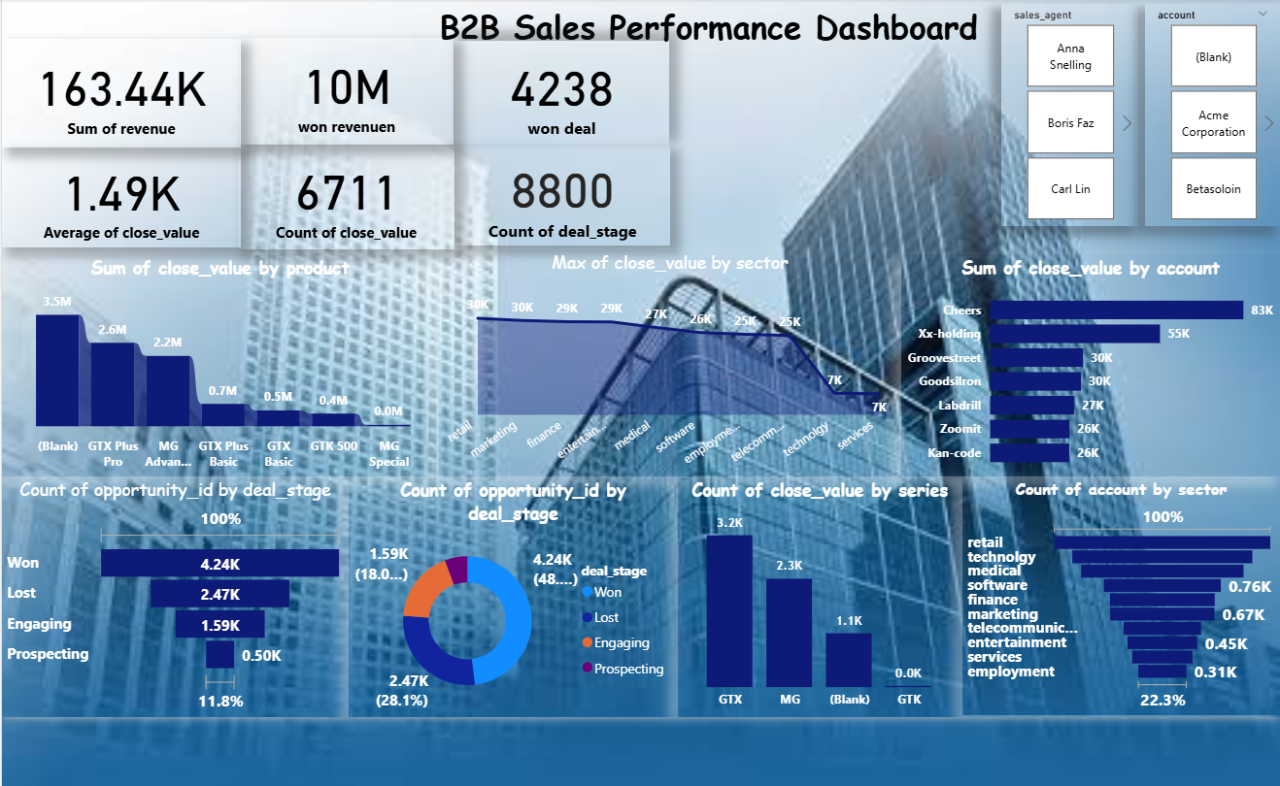
B2B Sales Performance Dashboard
Executive Power BI dashboard tracking pipeline health, revenue, and deal outcomes across sales agents, products, sectors, and accounts.
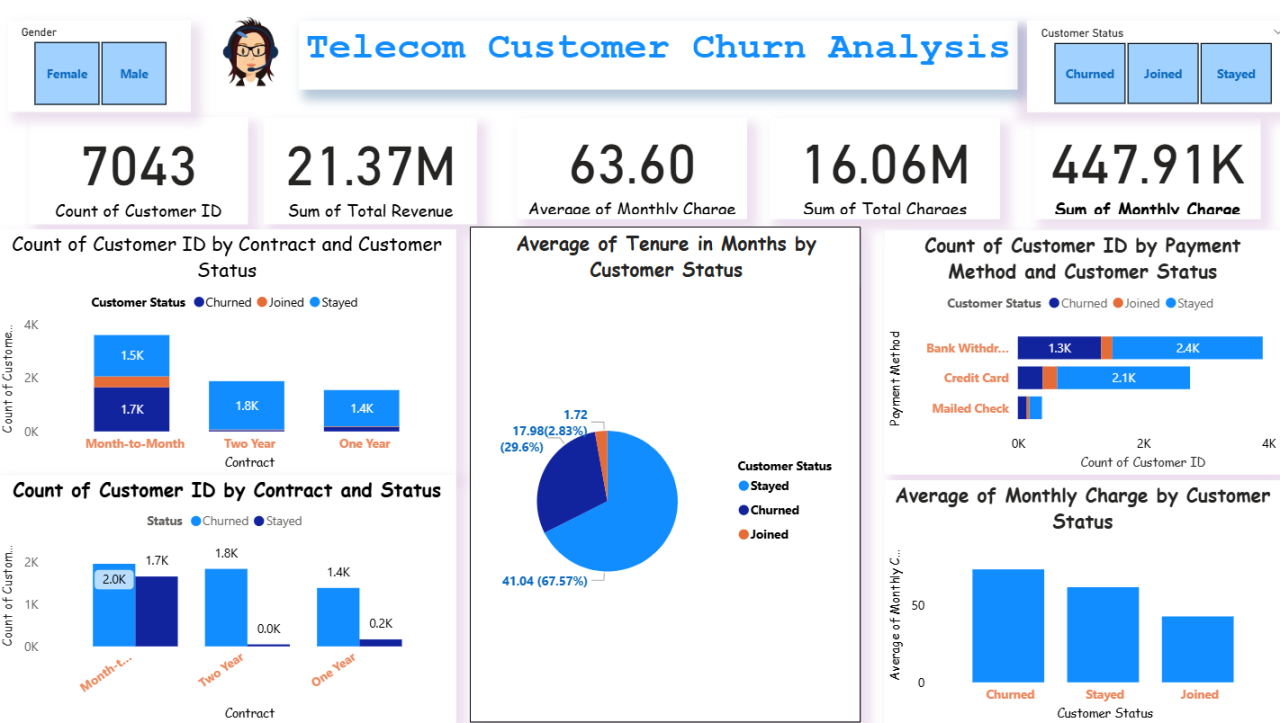
Telecom Customer Churn Analysis
Power BI dashboard analyzing 7,043 telecom customers to identify churn drivers across contract type, tenure, and payment method.
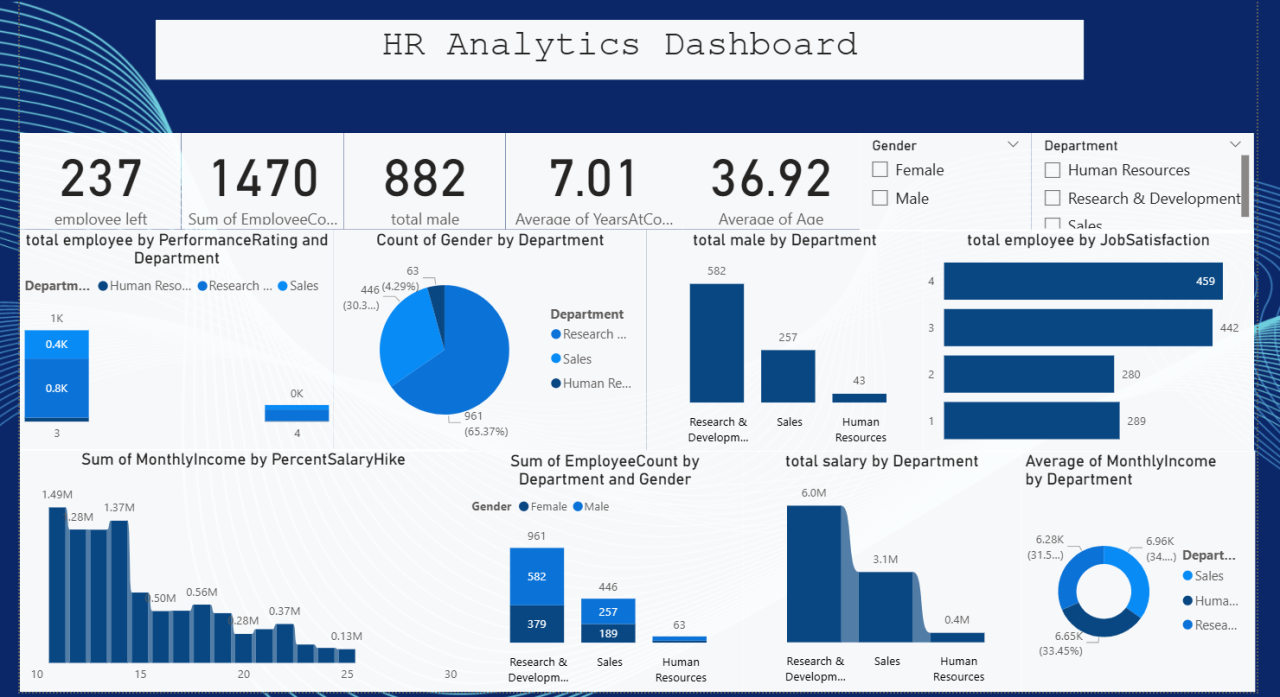
HR Analytics Dashboard
Power BI HR dashboard tracking headcount, attrition, satisfaction, salary, and performance across departments and demographics.
HR Attrition Analysis
Exploratory analysis of employee attrition patterns using Pandas and Matplotlib.
E-commerce Customer Insights (SQL)
SQL analysis of an e-commerce database to segment customers and surface revenue drivers.
Monthly Financial Reporting Workbook
Automated Excel reporting workbook with Power Query, pivot tables, and interactive charts.