Power BI
B2B Sales Performance Dashboard
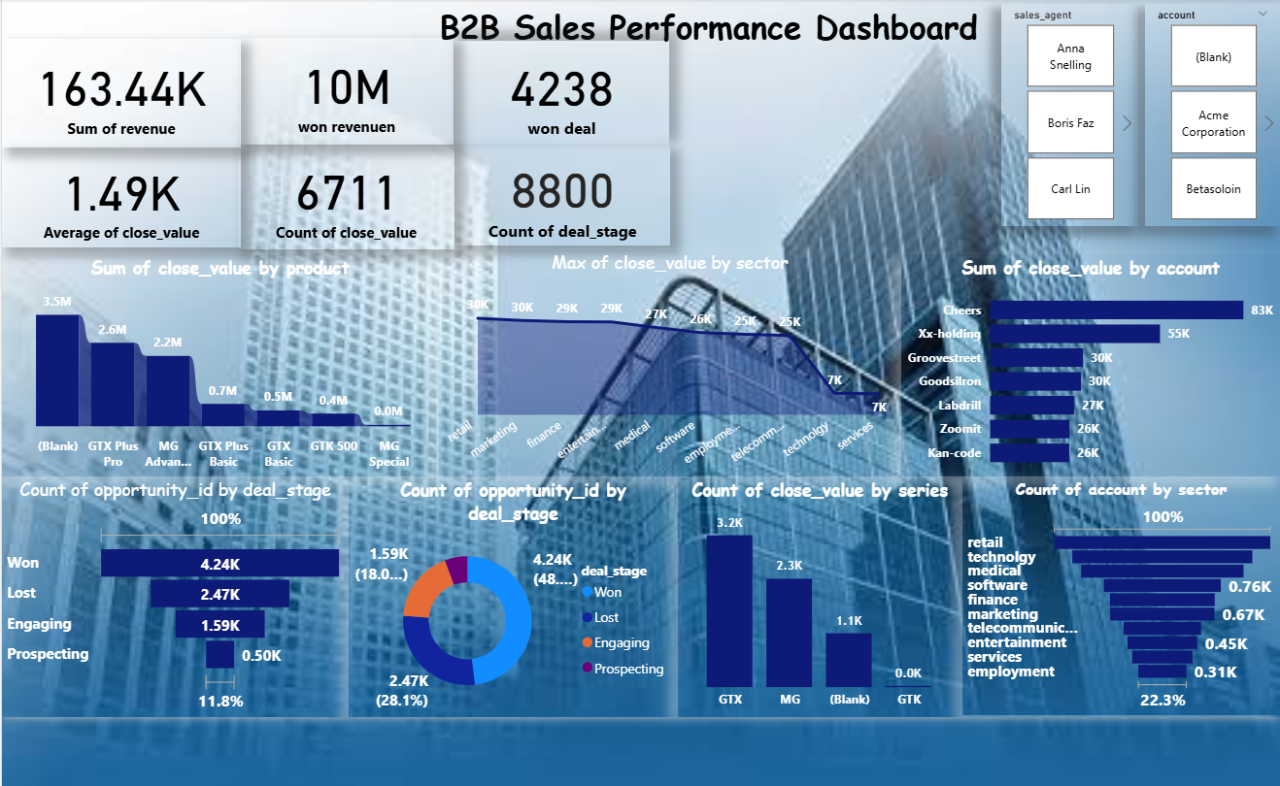
Executive Power BI dashboard tracking pipeline health, revenue, and deal outcomes across sales agents, products, sectors, and accounts.
Power BIDAXPower Query
Business problem
Sales leadership had no single view of pipeline conversion, product mix, and top accounts — reporting was fragmented across spreadsheets.
Solution
Modeled opportunity data, built KPI cards for revenue, won deals, and average close value, and layered in breakdowns by product, sector, account, and deal stage.
Key insights
- Total pipeline value of 21M, of which 10M was won revenue across 4,238 closed-won deals
- GTX Plus Pro led product revenue at 3.5M, followed by GTX Plus and MG Advanced
- Retail, technology, and medical were the top three sectors by account count
- Win rate sat around 48% with 28% of opportunities still lost — a clear area for coaching
Business impact
Gave sales managers a live view of pipeline performance and top-performing agents, accounts, and products in one screen.
Next project
Telecom Customer Churn Analysis