Power BI
Telecom Customer Churn Analysis
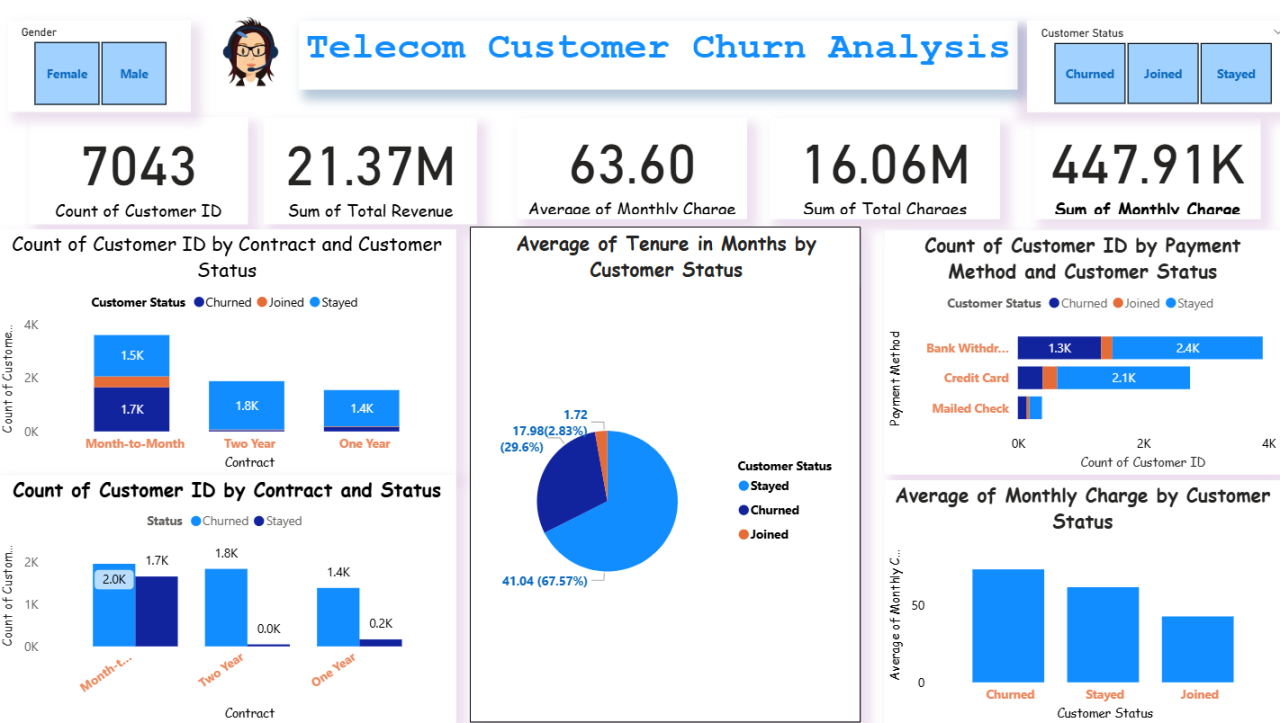
Power BI dashboard analyzing 7,043 telecom customers to identify churn drivers across contract type, tenure, and payment method.
Power BIDAXData Modeling
Business problem
The provider was losing customers but couldn't see which segments were churning fastest or why.
Solution
Built a churn dashboard segmenting customers by status (Churned / Joined / Stayed), contract length, tenure, monthly charge, and payment method.
Key insights
- Month-to-month contracts drove the vast majority of churn versus one- and two-year contracts
- Churned customers had noticeably shorter average tenure and higher monthly charges
- Bank withdrawal was the most common payment method among churned customers
- Total revenue of 21.37M with 447.9K in monthly charges at risk
Business impact
Highlighted month-to-month, high-charge customers as the priority retention segment for targeted offers.
Next project
HR Analytics Dashboard